InfoViz
Streamlit dashboard of US leading causes of death, 1999 to 2017, from the CDC/NCHS dataset.
Overview
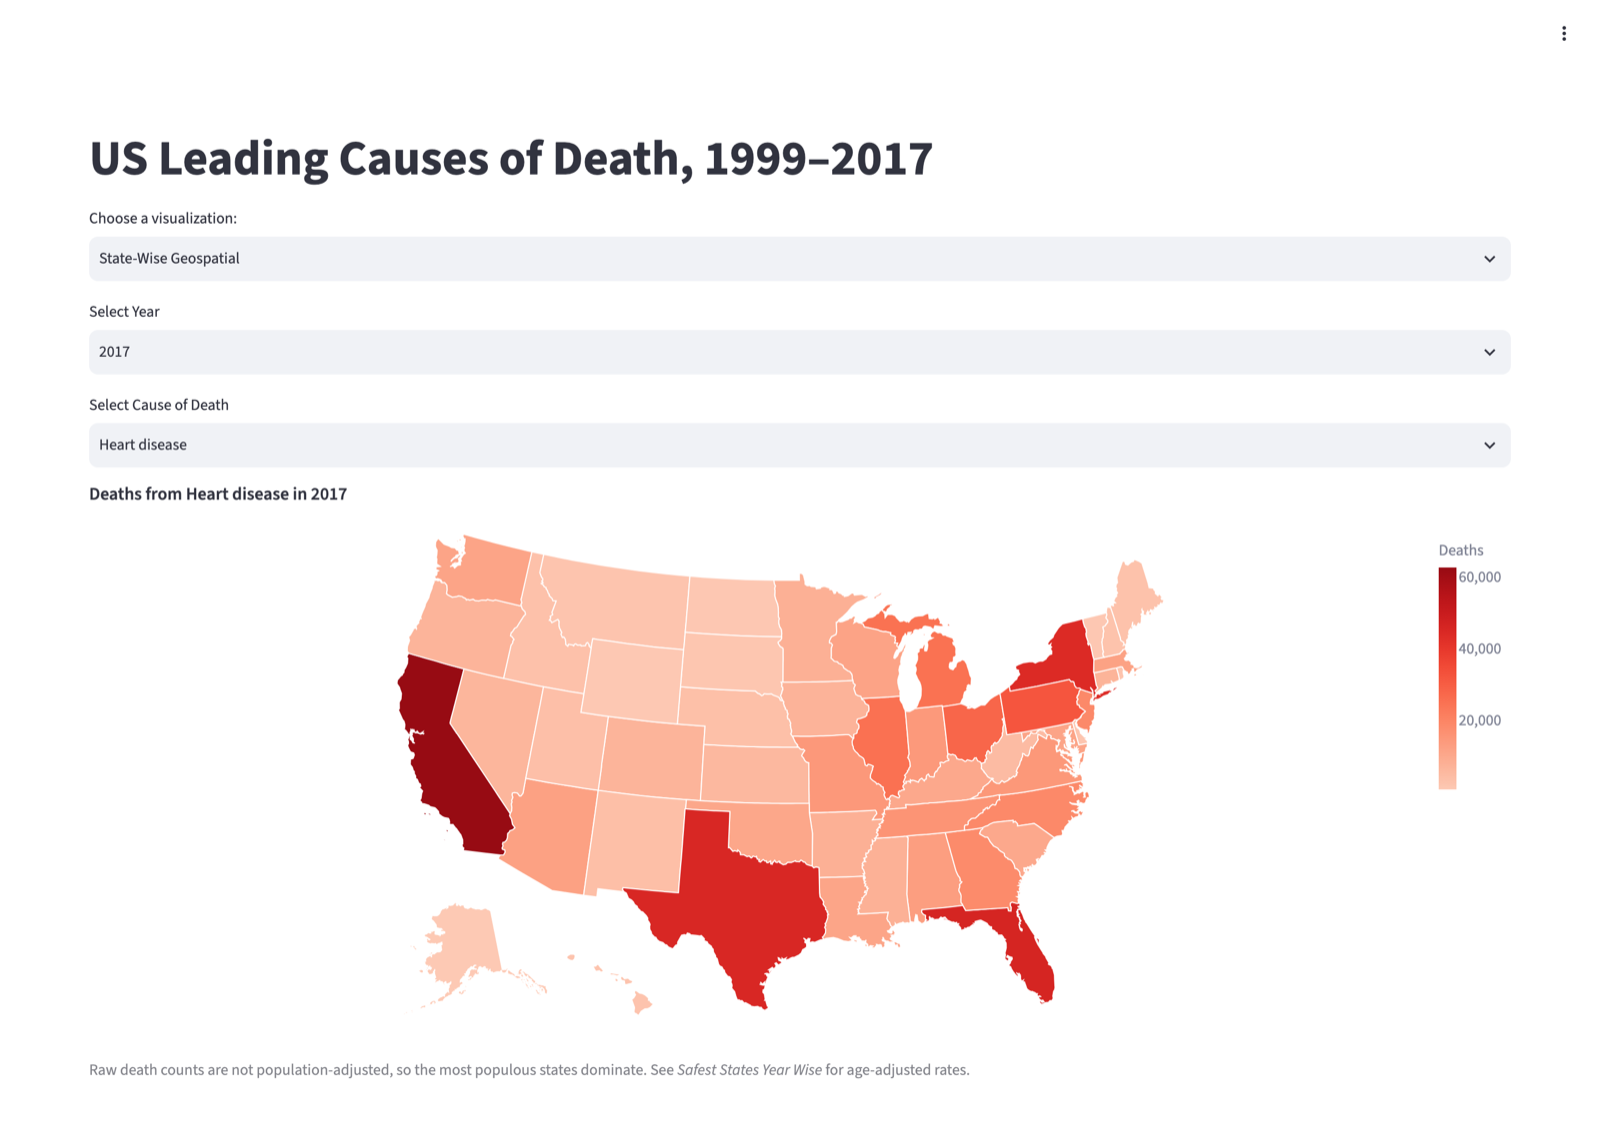
Four views of the NCHS Leading Causes of Death dataset: 10,868 rows covering ten causes plus an All causes rollup, for all 50 states, DC and a national total, 1999 to 2017. One map shades states by raw death count for a chosen year and cause.
By the numbers
- 4 views
- 10,868 rows
- 19 years of data
Highlights
- 01
Streamlit dashboard of US leading causes of death, 1999 to 2017: two choropleth maps, a time series with a fitted linear trend, and a per-year share by cause, built with Altair on the CDC/NCHS dataset.
- 02
Repaired in 2026 so it runs from a fresh clone: the dataset now downloads and caches itself, and the pie chart no longer counts every death twice by summing the national rollup rows with the states.
The story
A second shades them by age-adjusted rate per 100,000, which is the one that supports a fair state-to-state comparison. A time series shows nationwide deaths per year for one cause with a dashed linear-regression line, and a pie chart gives each cause's share of a chosen year's deaths.
Four views of the NCHS Leading Causes of Death dataset: 10,868 rows covering ten causes plus an All causes rollup, for all 50 states, DC and a national total, 1999 to 2017. One map shades states by raw death count for a chosen year and cause. A second shades them by age-adjusted rate per 100,000, which is the one that supports a fair state-to-state comparison. A time series shows nationwide deaths per year for one cause with a dashed linear-regression line, and a pie chart gives each cause’s share of a chosen year’s deaths.
The whole app is one file, streamlit_app.py. Charts are Altair, the maps join the data onto Vega’s us_10m TopoJSON by FIPS code, and the three data functions sit behind st.cache_data so a dropdown change re-renders without re-reading the CSV. The dataset is fetched from the CDC on first run and cached next to the script.
In September 2026 I went back and fixed it. A fresh clone could not start: the CSV was never committed and an unused geopandas import blocked launch. The pie chart crashed on current pandas and, before that, counted every death twice by including the United States rollup rows in the state sum (cancer in 2017 read 1,198,216 against the true 599,108). I replaced deprecated Altair and Streamlit calls, added requirements, a .gitignore and an MIT license, and rewrote the README. Checked from a clean clone: all four views render with no exceptions.